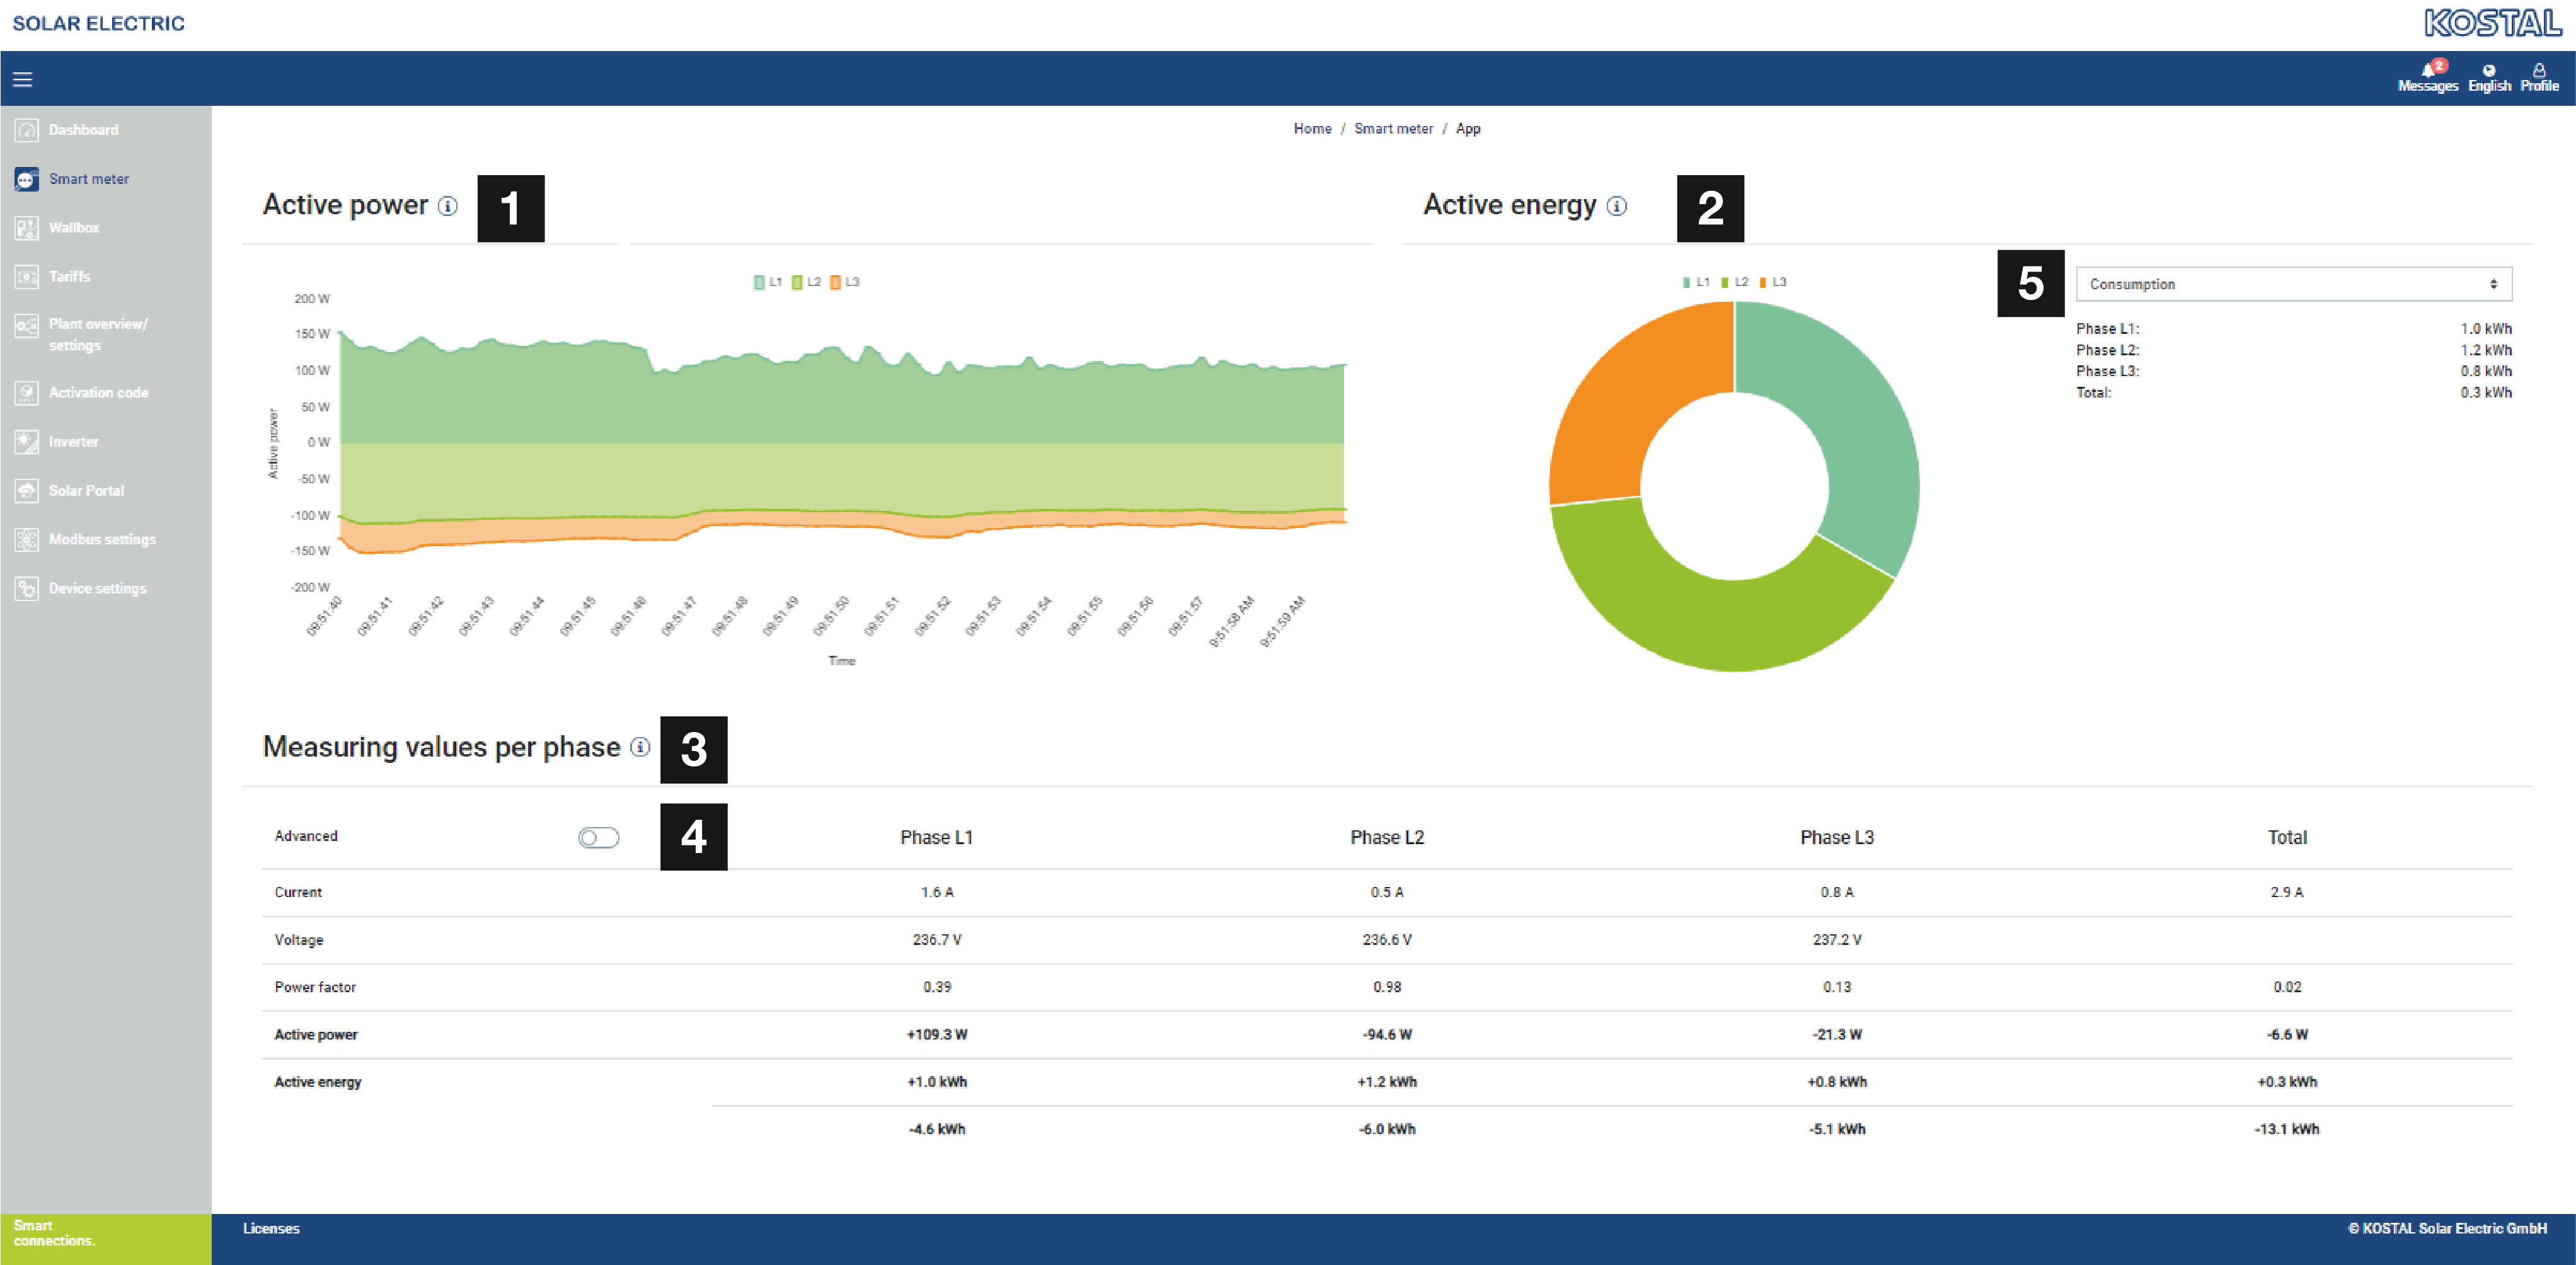
Menu - smart meter

1 | Active power display (total of all phases) |
2 | Active energy display, shown by consumption or purchase per phase |
3 | Measuring values per phase |
4 | Enhanced mode, measuring values with apparent and reactive power/energy |
5 | Selection of purchase/feed-in |
The graphics provide the user with an overview of whether the entire system is purchasing or feeding in power at the present time.
All power and energy values are indicated separately as purchase (+) and feed-in (-).
Active power
The diagram shows totals for the power of the individual phases. The active power (P) is the amount of converted power actually being used by the consumer. It is measured in watts.
Active energy
The diagram and table show the power values for the entire system per phase as a total for consumption or feed-in. The active energy is the power generated over a certain period. It is stated in watt-hours.
Measuring values per phase
The table shows all measuring values recorded by the system per phase. In advanced mode, apparent and reactive power/energy are also displayed.